

What the Q2 2026 manufacturing numbers reveal about operational efficiency, visibility and the future of industrial competitiveness.
Nigeria's economy grew by 4.43 per cent in the second quarter of 2026, up from 3.89 per cent in the first, according to National Bureau of Statistics (NBS) figures reported by The Guardian. On the surface, that is encouraging.
Beneath the headline, the productive economy tells a more complicated story. Industrial sector growth fell from 7.46 per cent in Q2 2025 to 3.96 per cent in Q2 2026. The Manufacturers Association of Nigeria (MAN) responded by warning that the headline figure was masking deeper challenges for manufacturers.
This article does not argue that Nigerian manufacturing is failing. The data does not support that conclusion, and a simple story would be a wrong one. It asks a narrower question, one that sits underneath the cost debate: of all the pressure on industrial performance, how much can be understood, measured and improved inside the plant itself?
What the Q2 2026 numbers actually say
Start with what the published figures show, because the details matter more than the headline.
- The economy grew 4.43 per cent. Industry accounted for 17.23 per cent of real GDP and grew 3.96 per cent, down sharply from 7.46 per cent a year earlier, according to the NBS report.
- The weak spot in industry was power. MAN's Director General attributed much of the slowdown to the electricity, gas, steam and air conditioning supply segment, which contracted by 10.63 per cent.
- Manufacturing grew 3.24 per cent in real terms. That is essentially level with the 3.29 per cent recorded in Q1 2026, and roughly double the 1.6 per cent NBS reported for the same quarter of 2025.
- The growth was uneven. Oil refining grew 43.94 per cent and cement grew 12.75 per cent. Labour intensive activities were weaker: textiles, apparel and footwear (22.95 per cent of manufacturing real GDP) contracted 1.23 per cent, and motor vehicles and assembly contracted 1.02 per cent. Food, beverage and tobacco, the largest group at 36.58 per cent of the total, grew only 2.79 per cent, which MAN linked to weak consumer purchasing power and food inflation.
There is one more number worth handling carefully. Manufacturing's contribution to real GDP fell from 9.57 per cent in Q1 to 7.72 per cent in Q2. Read in isolation, that looks like a sharp deterioration.
It is less dramatic than it sounds. The same dip appeared a year earlier: as originally reported, manufacturing's share fell from 9.62 per cent in Q1 2025 to 7.81 per cent in Q2 2025, over the same quarters in which agriculture's share rose from 23.33 to 26.17 per cent. A share is a ratio. When a very large sector swells in the second quarter, every other sector's share shrinks with it.
The fairer comparison is year on year: 7.72 per cent against 7.81 per cent. That small slip is exactly what you would expect when manufacturing grows 3.24 per cent inside an economy growing 4.43 per cent. It is a real signal, and MAN is right to flag it. But the signal is that manufacturing is growing more slowly than the economy around it. It is not that the sector has shrunk.
The honest reading of Q2 is not decline. It is a sector that is growing, but not fast enough to gain ground.

Manufacturers are not standing still
The picture also has a more optimistic side, and it deserves equal weight.
MAN's Q2 2026 Manufacturers' CEOs Confidence Index rose to 52.1 points from 48.7 in Q1, moving back above the 50 point neutral line. MAN tied the improvement to the expected effects of the Nigeria Tax Act 2025, the Nigeria Industrial Policy and the Nigeria First policy. The index is based on the views of 400 CEOs, so it measures sentiment and expectation rather than output. Even so, it says something. Manufacturers are operating in a difficult environment, continuing to grow, and expecting conditions to improve.
The next question, then, is not whether Nigerian manufacturers will keep going. It is how they build more productivity and resilience into the operations they already run.
The cost story is real. It is also incomplete.
MAN's account of the pressure is specific. Its Director General pointed to exchange rate volatility, high interest rates and high electricity tariffs, and said they were forcing many manufacturers, particularly small and medium sized ones, to operate significantly below installed capacity. The Q2 confidence survey named access to finance as manufacturers' primary challenge, with two in three CEOs citing commercial bank lending rates as a disincentive, against a Monetary Policy Rate of 26.5 per cent.
MAN has called for interventions on energy, financing, foreign exchange and industrial policy. Those matter, and none of them can be fixed from a factory floor. No plant manager can lower a tariff or an interest rate.
But the phrase operating below installed capacity points at something that is operational as much as macroeconomic. MAN has reported capacity utilisation rising from 57.6 per cent in late 2024 to 61.3 per cent during 2025. The Nigerian Economic Summit Group (NESG), in a report on industrialisation, said capacity utilisation has consistently stayed below 60 per cent and estimated manufacturing productivity growth at only 0.4 per cent in 2024.
On either measure, a large share of installed capacity is not producing. Cost pressure helps explain why capacity sits idle. It does not explain which capacity, at what time, for what reason, inside any individual plant. That is a different kind of question, and it needs a different kind of answer.
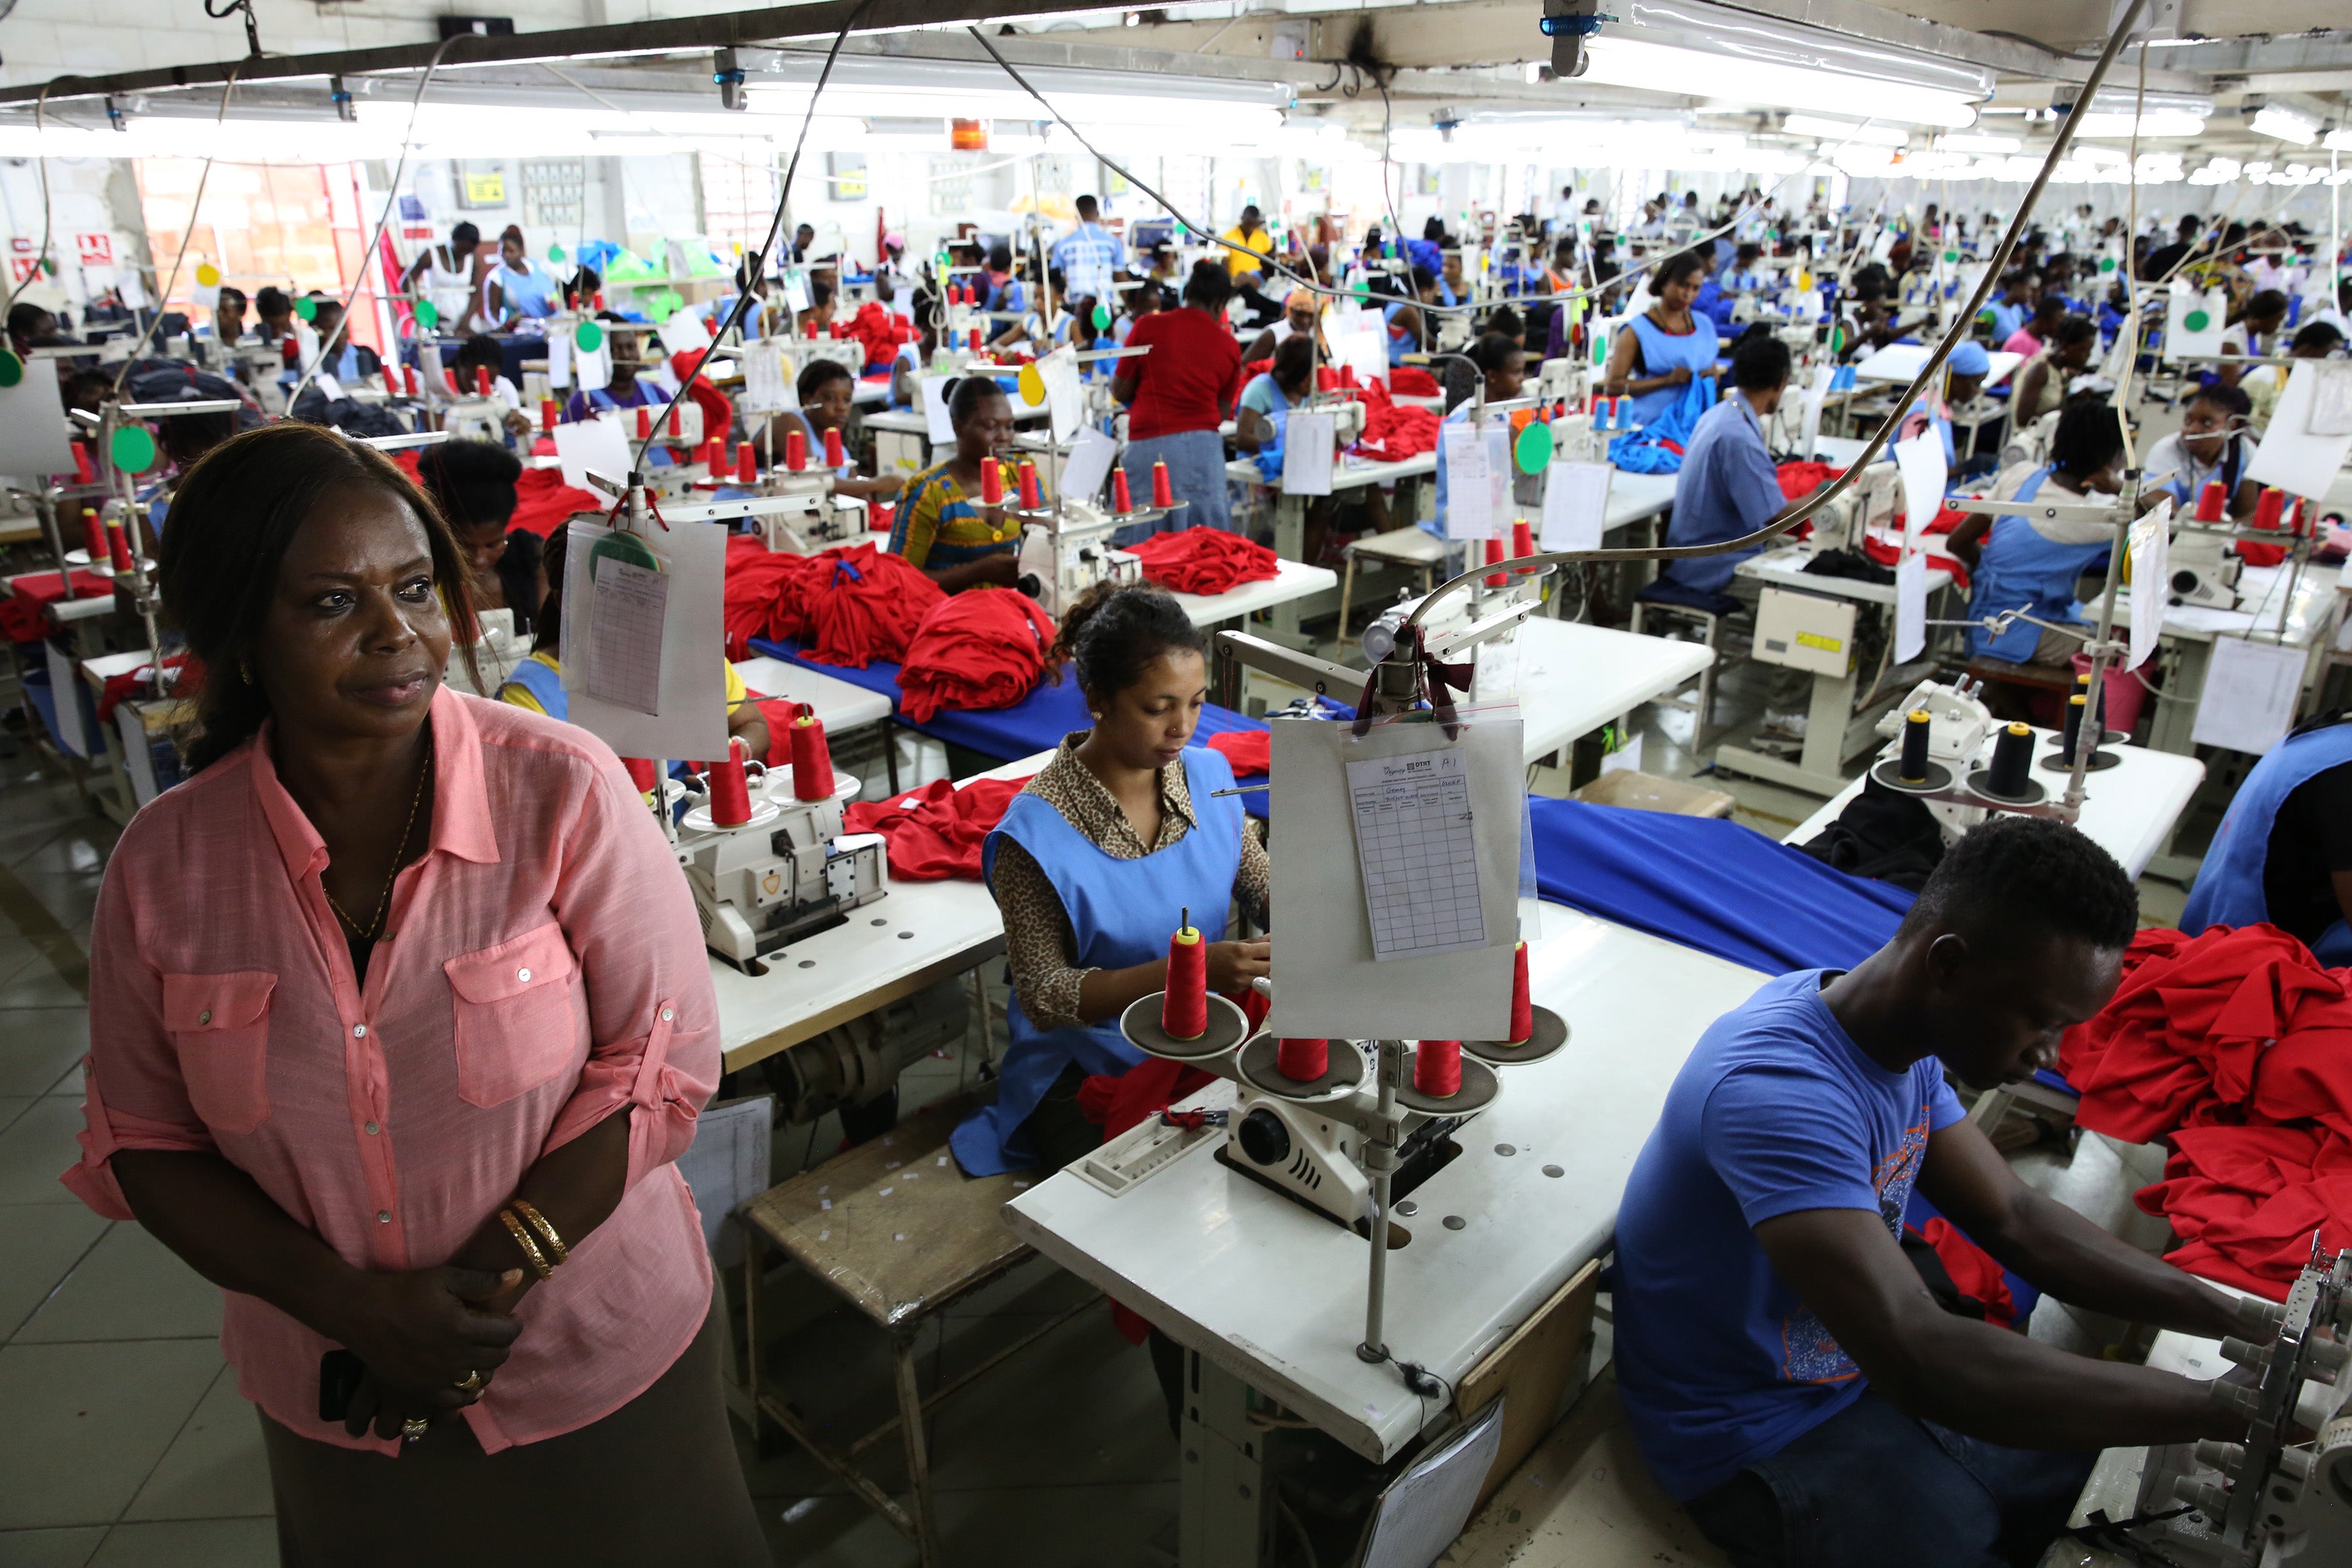
There is another layer: how well the operation itself performs
When margins come under pressure, businesses naturally look at energy, raw materials, labour, logistics, financing, exchange rates and equipment costs. All of those deserve attention.
There is one more layer that rarely gets the same scrutiny: how efficiently the operation is performing with the inputs it already has. The questions sit in a few clusters.
On utilisation and losses: how much production capacity is actually being used, and where are production losses occurring? On stoppages and energy: how often does equipment stop, how much of that downtime is planned versus unplanned, and how much energy does each unit of output consume? On material and time: how much material becomes waste, how long does a production cycle really take, and where are bottlenecks forming? On detection and reconciliation: how quickly can management spot an abnormal operating condition, and can production data be reconciled with inventory, maintenance and financial information without someone doing it by hand?
These are not abstract technology questions. They are performance questions. In many plants they are answered from memory, from end of shift logs, or not at all.
Financial statements tell you what cost more. They cannot tell you why.
This is where monthly accounts reach their limit.
A financial statement can tell you that production costs increased. It cannot tell you why. Operational data has to answer that, and the possible causes are very different from one another: higher energy consumption, machine downtime, reduced throughput, material waste, longer cycle times, maintenance problems, quality failures, poor production scheduling, or capacity that was simply underused.
Each of those has a different remedy, and some cost almost nothing to fix once they are identified. Without operational visibility, they all show up as the same line item, and the organisation responds to the symptom. We made the same argument about shift reporting in Your Factory Doesn't Have a Production Problem. It Has a Visibility Problem. Aggregated, late data turns a fixable operating problem into a management discussion.
A cost increase is a symptom. The operation is where the cause lives.
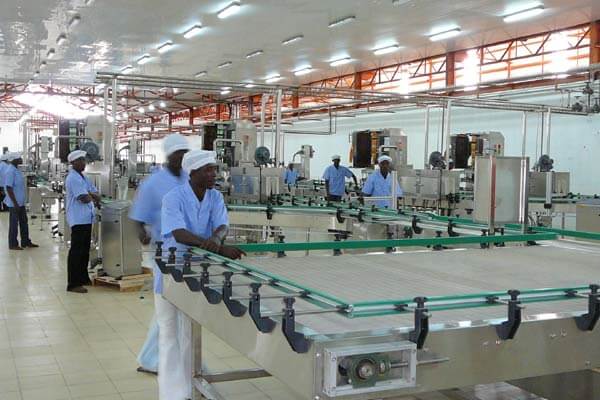
Visibility, control and intelligence: in that order
Performance improvement follows a sequence, set out in The Difference Between Visibility, Control and Intelligence in Complex Operations. Visibility answers what is happening. Control answers what can be influenced. Intelligence answers what should be done next, and why.
Take an illustration. A plant's energy cost per month has risen, and the finance team can see it on the bill. That is cost visibility, but not operational visibility. Operational visibility would measure energy against output, by line and by shift, while the shift is still running. Control would mean the plant can actually act on what it sees: sequencing energy intensive runs, scheduling changeovers, shutting down idle equipment. Intelligence would mean knowing which of those actions reduces energy per unit of output without slowing the constraint that governs the whole plant's throughput.
Skip the first layer and the later ones fail. You cannot build intelligence on data you do not trust, and you cannot control what you cannot see. This is the argument made in Why Operational Visibility Must Come Before Automation: before an organisation can optimise an operation it needs to see it, before it can automate it needs to understand it, and before it can build intelligence around it, it needs reliable operational data.
Technology comes later, and it should be built around decisions
Modern industrial operations increasingly depend on systems that capture, structure and communicate what is happening on the factory floor. Sensors, meters, PLCs, HMIs, SCADA systems, historians, MES platforms and enterprise systems can each contribute to that visibility.
Forecasters expect adoption to grow. PwC's 2026 outlook, as reported by ThisDay, listed deeper adoption of AI automation and smart factory models among the supports for projected manufacturing growth of around 3.1 per cent. That adoption will pay off where a plant knows which decisions it needs to make better. It will disappoint where technology is bought first and the problem is defined afterwards.
Technology alone does not solve an operational problem. The real question is whether the organisation has designed its systems around the decisions it needs to make. As we argued in How to Detect Engineering Bottlenecks Before They Become Operational Problems, the starting point is not the software. It is the constraint.
What this means for competitiveness
Nigeria's industrial competitiveness will not be determined only by how much manufacturers produce. It will also depend on how well they understand and manage the operations producing it.
In an environment where energy, financing, logistics and input costs remain significant constraints, operational visibility becomes more than a technology capability. It becomes a management capability. A plant that can see where its time, energy and material go can respond to cost pressure with precision, rather than with across the board cuts that damage the parts of the operation that were working.
None of this replaces the policy reforms MAN is calling for. Cheaper power and credit would help every plant. But they would help most the plants that know where their capacity is going, and least the ones that cannot tell.
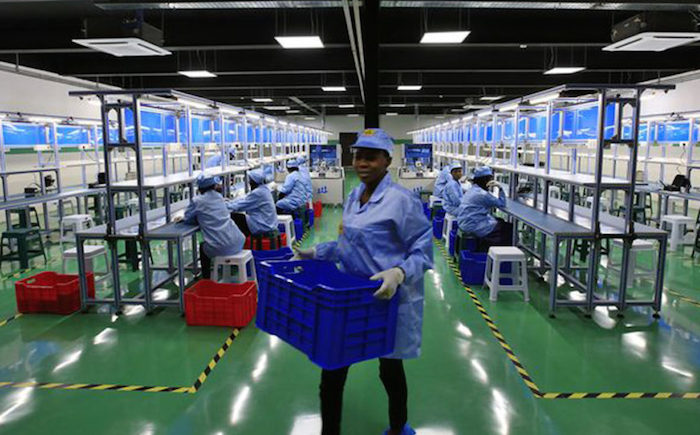
Five questions to ask before the next cost review
- Which of our cost increases can we trace to a specific cause on the floor, and which are we assuming?
- What is our measured capacity utilisation on the constraint asset, captured automatically or estimated by hand?
- When a line stops, how long until someone who can fix it knows, and how much of our downtime is unplanned?
- Do we know our energy consumption per unit of output by line, or only the total on the monthly bill?
- Can production, inventory, maintenance and financial data be reconciled without someone doing it manually?
If the honest answer to most of these is we don't know, that is not a failure. It is the starting point, and it is far cheaper to find out than to keep paying for what the numbers are hiding.
Find out what your numbers are hiding?
Until 31 December 2026, TENNXT is offering a free Operations Audit to manufacturing, logistics, healthcare and agro processing businesses in Nigeria. Audit slots are limited.
Further reading:
- Your Factory Doesn't Have a Production Problem. It Has a Visibility Problem.
- The Difference Between Visibility, Control and Intelligence in Complex Operations
- Why Operational Visibility Must Come Before Automation
- How to Detect Engineering Bottlenecks Before They Become Operational Problems
- The Operational Mistakes That Keep Complex Businesses Running Below Their Potential
- Why Enterprise Software Projects Fail Before Development Begins
Sources:
- The Guardian Nigeria, MAN decries industrial sector GDP decline to 3.96%, 4 September 2026
- Voice of Nigeria, Nigeria's GDP Growth Accelerates to 4.43% in Q2 2026
- NGN Market, MAN Confidence Index Rebounds to 52.1 in Q2 2026
- allAfrica, report on MAN's Q2 2026 Manufacturers' CEOs Confidence Index, 17 August 2026
- Economic Confidential, NBS Announces 4.23% Economic Growth in Q2 2025
- Arise News, Nigeria's GDP Grows 4.23% in Q2, NBS Reports
- The Guardian Nigeria, NESG report on Nigeria's industrialisation
- NAN, MAN seeks stronger government industry collaboration
- ThisDay, Manufacturers Target 10.2% Contribution to GDP in 2026, 14 January 2026
2025 comparison figures are as originally reported by NBS and may have since been revised.
Joshua Otomo is Founder and Chief Executive Officer of Tennext Core Ltd (TENNXT), an enterprise systems integrator focused on intelligent software, industrial automation and operational analytics. He writes about how large organisations get technology projects right and, more often, why they don't.
Contact: hello@tennxt.com · www.tennxt.com


